
In the previous article I have discussed about how to send the logging from Azure Event Hub to a SQL database using Stream Analytics. In this article, I am going to discuss on how to utilize the data to generate reports using Power BI Dashboard.
I was under impression that Power BI is only available for Enterprise Users and we cannot sign in or work with it using our personal email accounts. But, desktop version of Power BI can be downloaded and used for generating dashboards and reports and you do not need not sign in with any account. To share or publish your dashboards and reports, we need to sign in with School or Work emails.
I am here using desktop version of Power BI to show how can we use the logging data for generating reports. Though for this article, I have collected simple data from the logs in real time we will be getting opportunity to store huge collection of log data that is useful to the management for the insights.
You can download desktop version of Power BI from https://powerbi.microsoft.com/en-us/get-started/#
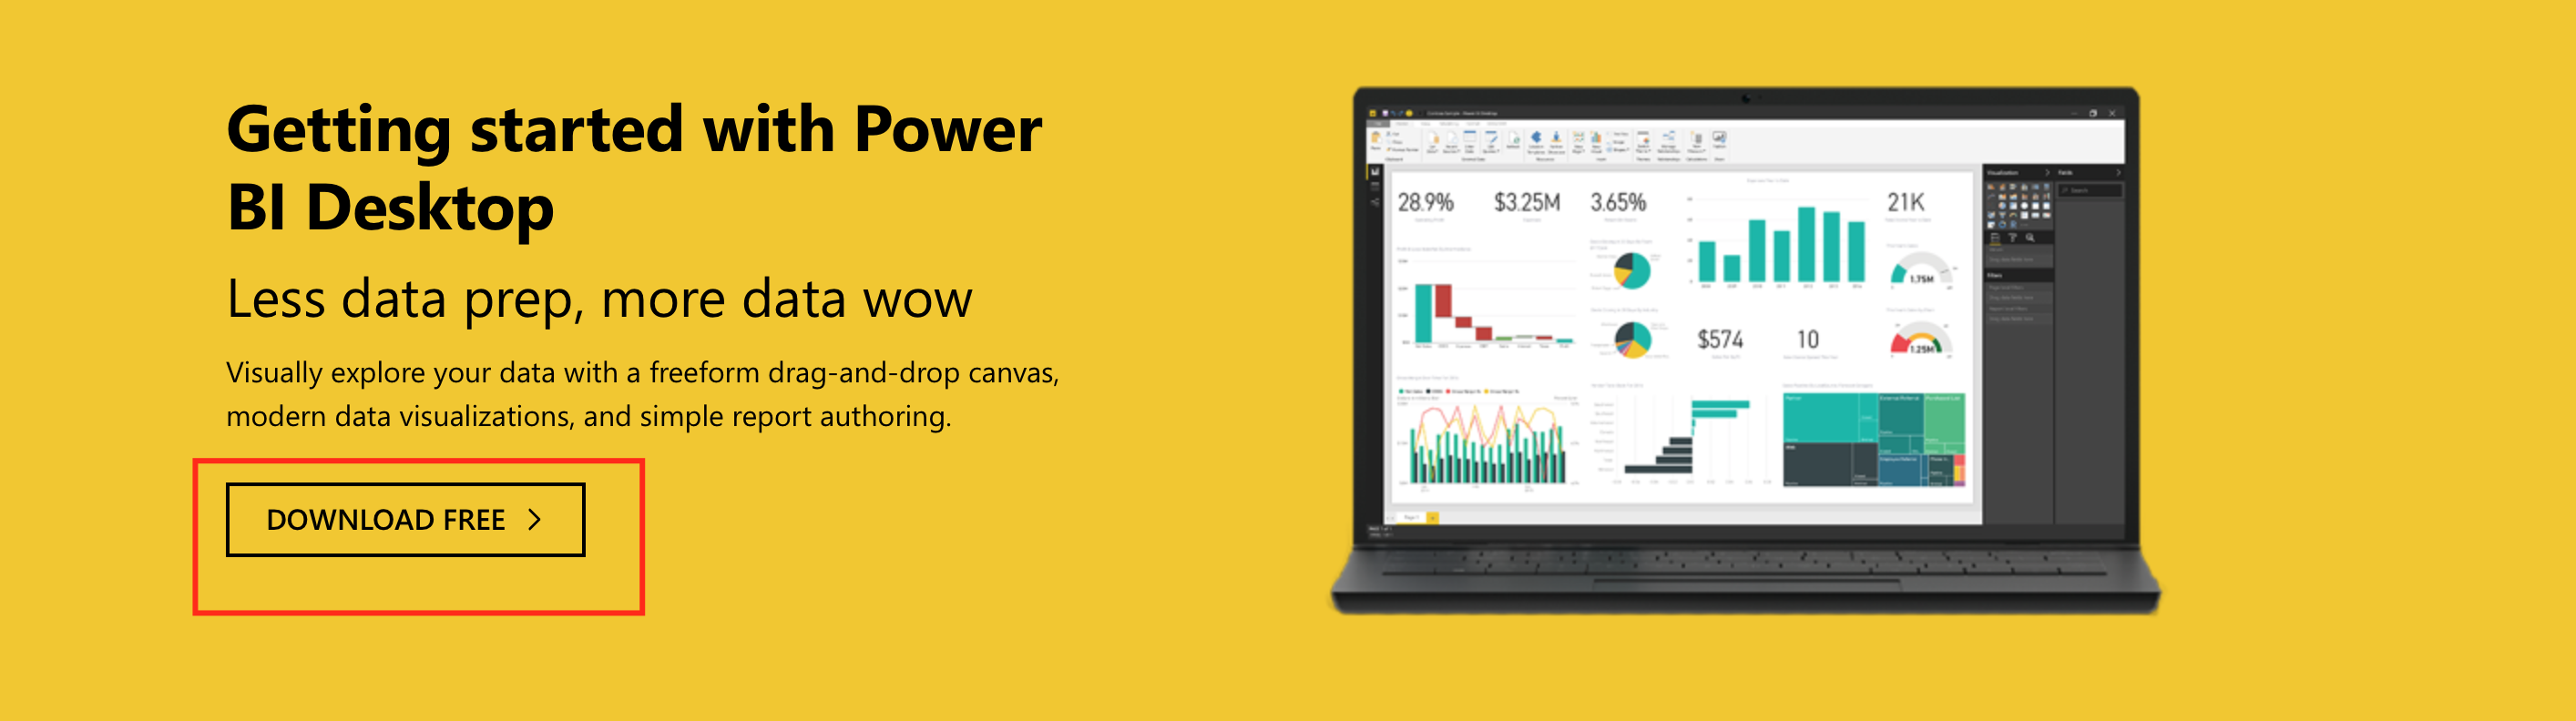
Figure 115 – Power BI Desktop version
Once you install the Power BI, click on the Power BI icon created on your desktop had you chose to create a short cut on your desktop.
Figure 116 – Desktop shortcut for Power BI
Select the menu item “Get Data” as shown in the figure 117 and select “More…”. Once clicking the “More…” option you should select “Azure” and “Azure SQL Database” as shown in the figure 118 to select the database we have created in the previous article to dump the logging data. Once selected the database, then click connect button.
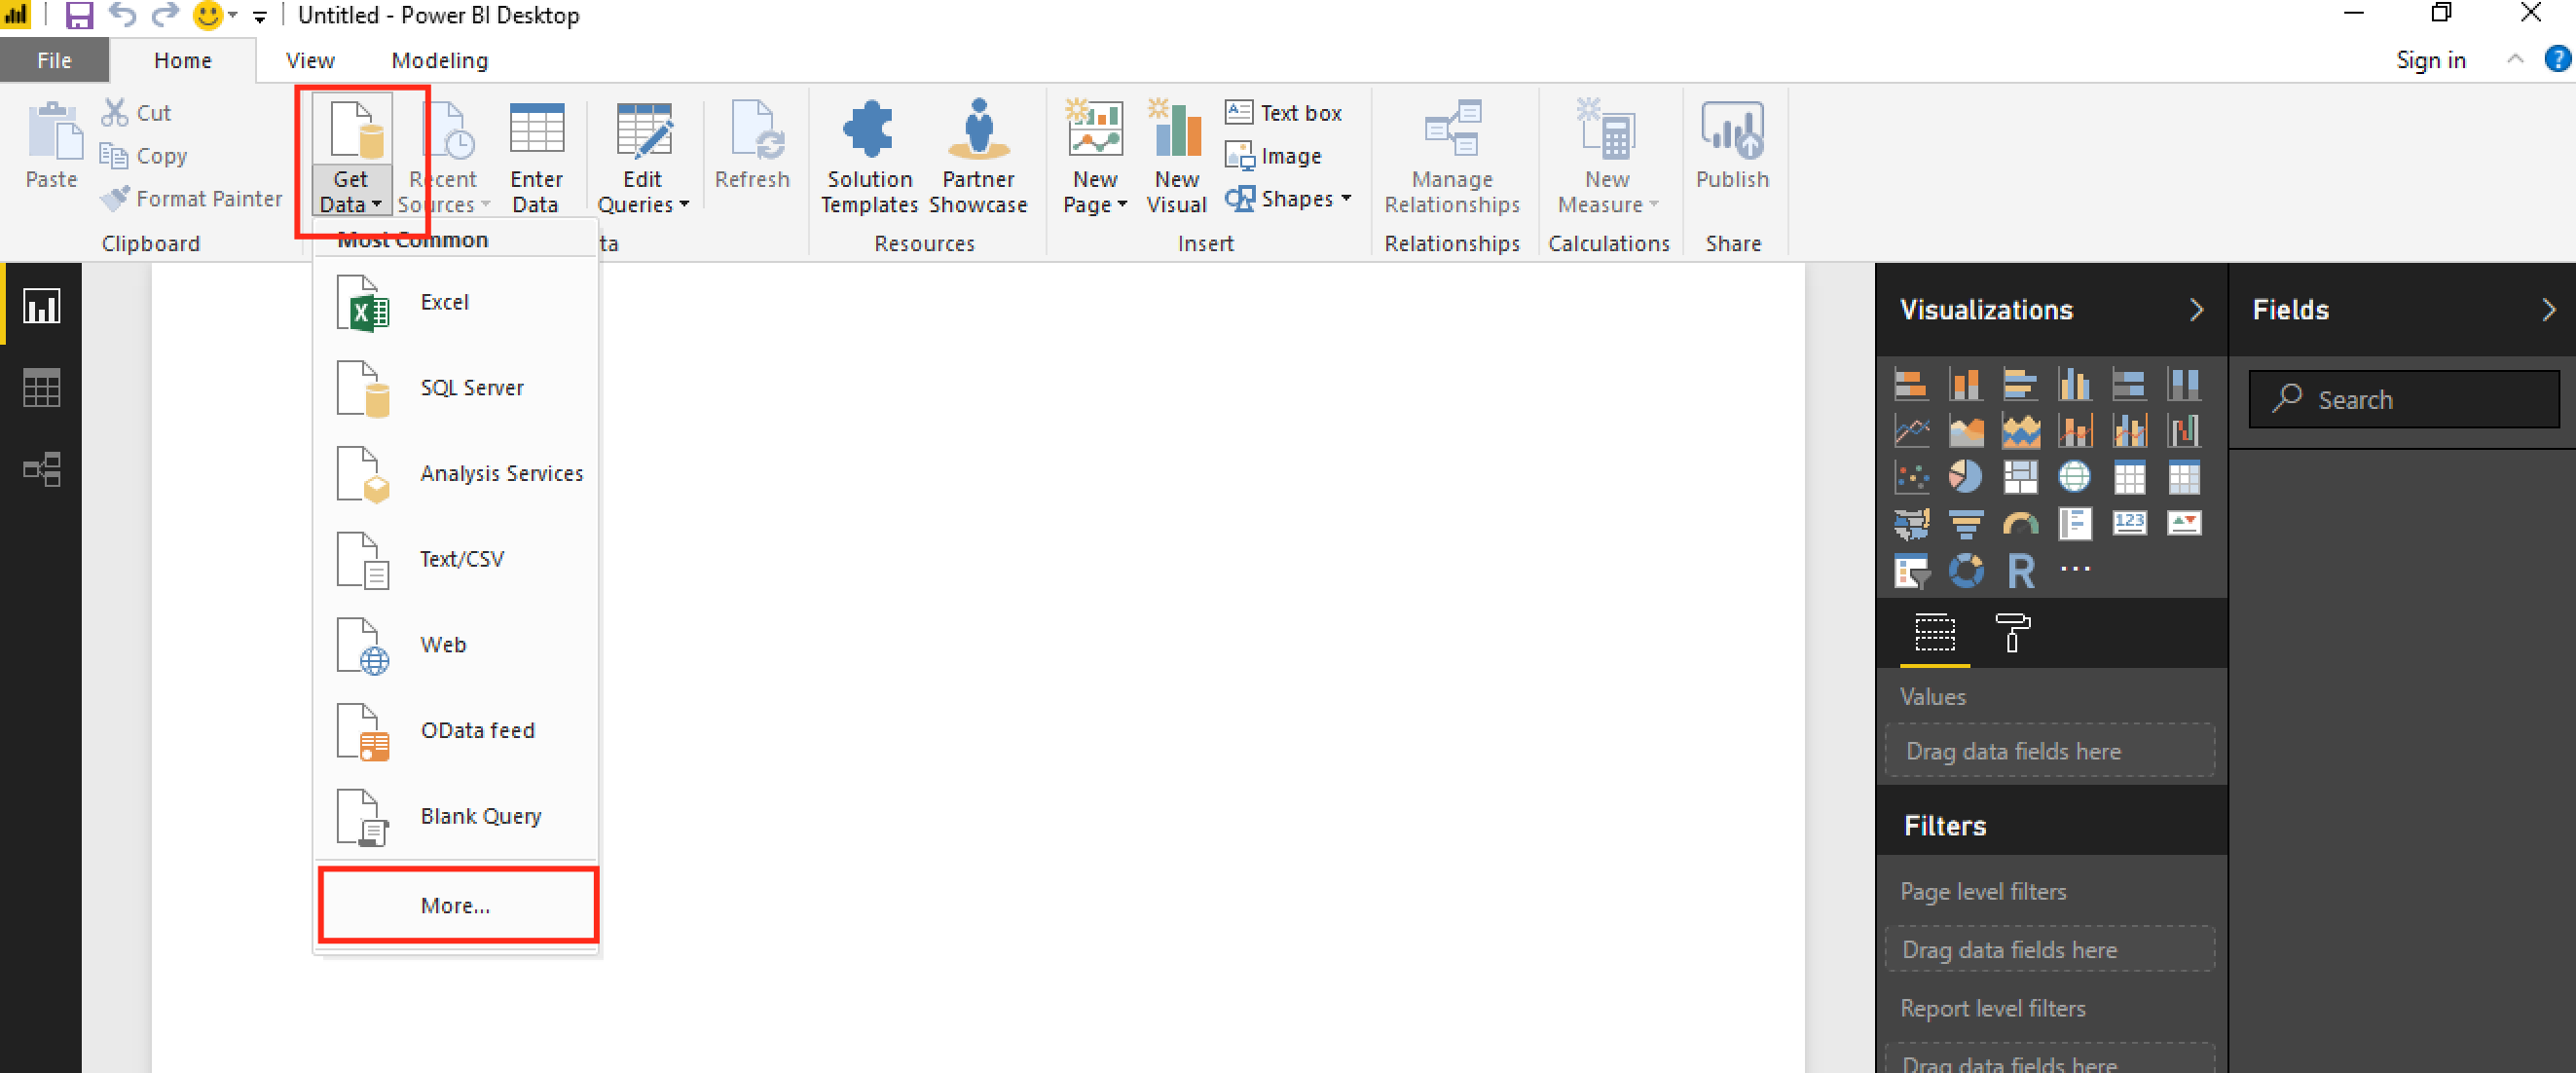
Figure 117 – Get Data
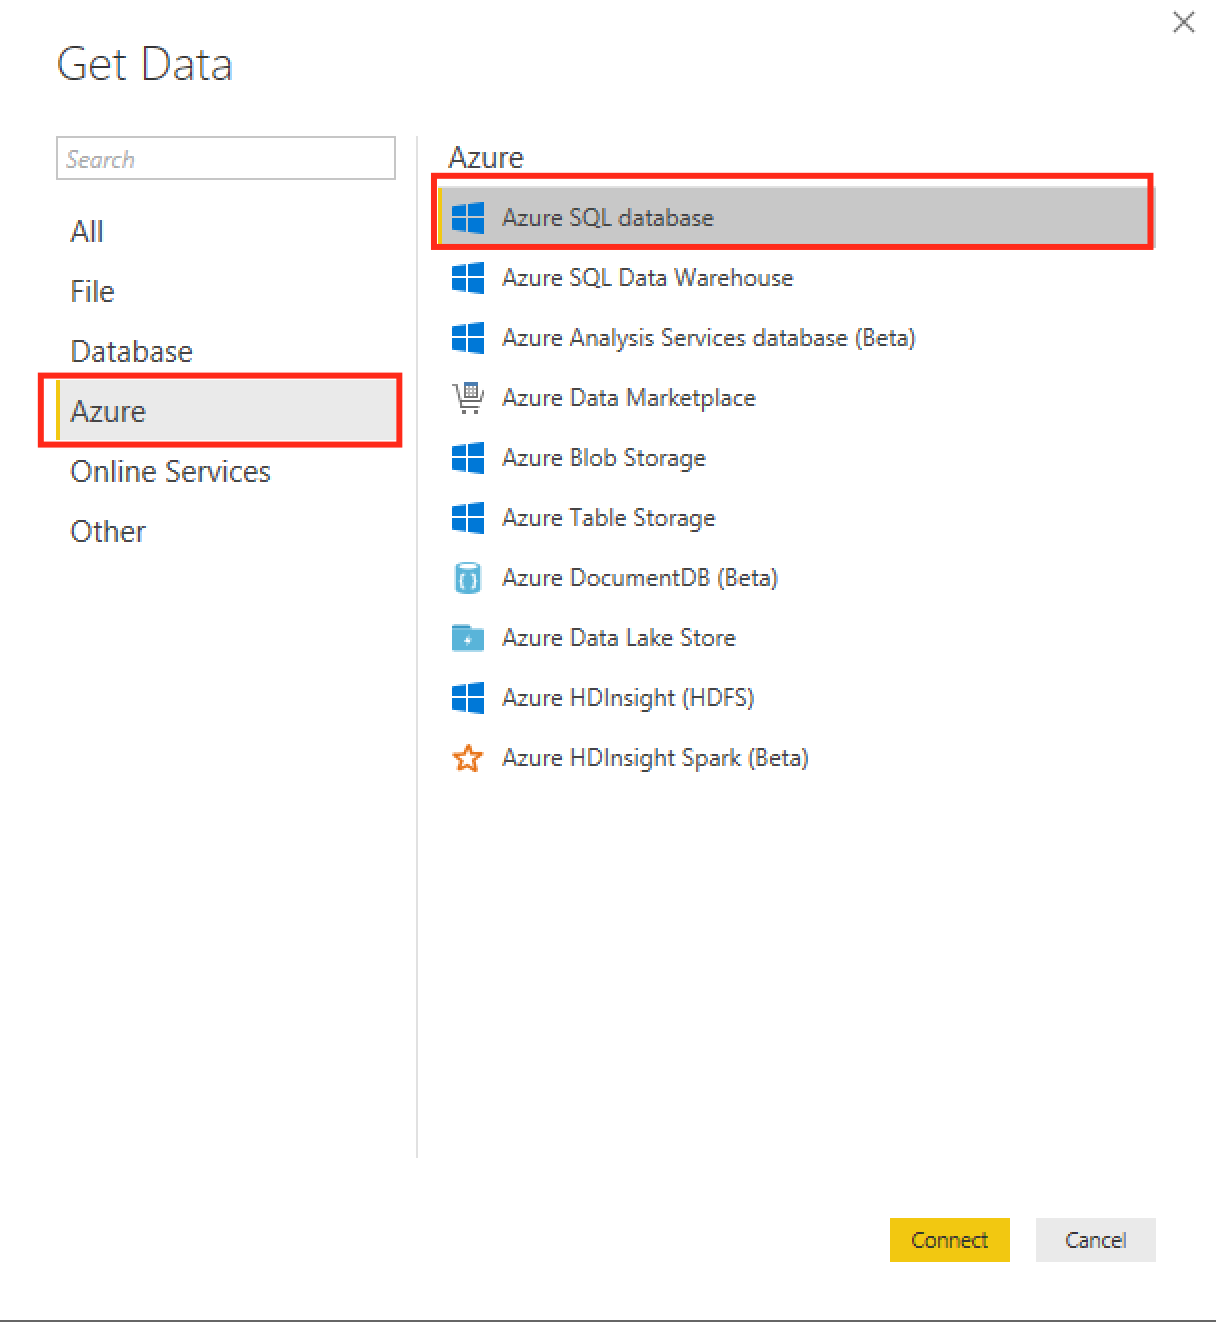
Figure 118 – Connecting to Azure SQL Database
After clicking “Connect” button, next window screen will show the options to enter the database server name and the database name. Enter the values and then select “Data Connectivity mode” as “Import” and click OK button.
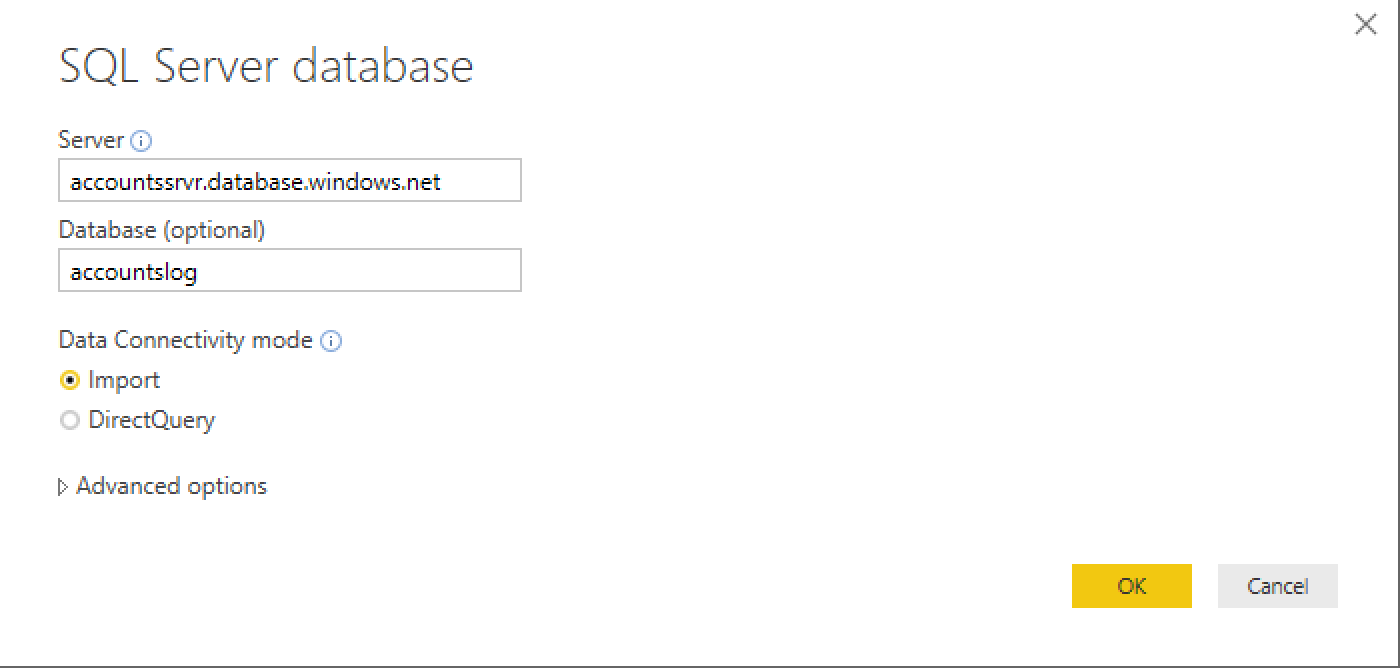
Figure 119 – SQL Server database
Since we are not using Windows authentication for connecting to the database, select “Database” and enter the credentials that you used to create the database server name and click “Connect” button.

Figure 120 – Database server credentials
Next select the table name that we want to use to create the dashboard. In our case the table name is “logging” and it will display the records on the right-hand side of the window. Click on the button “Load” to load the data.
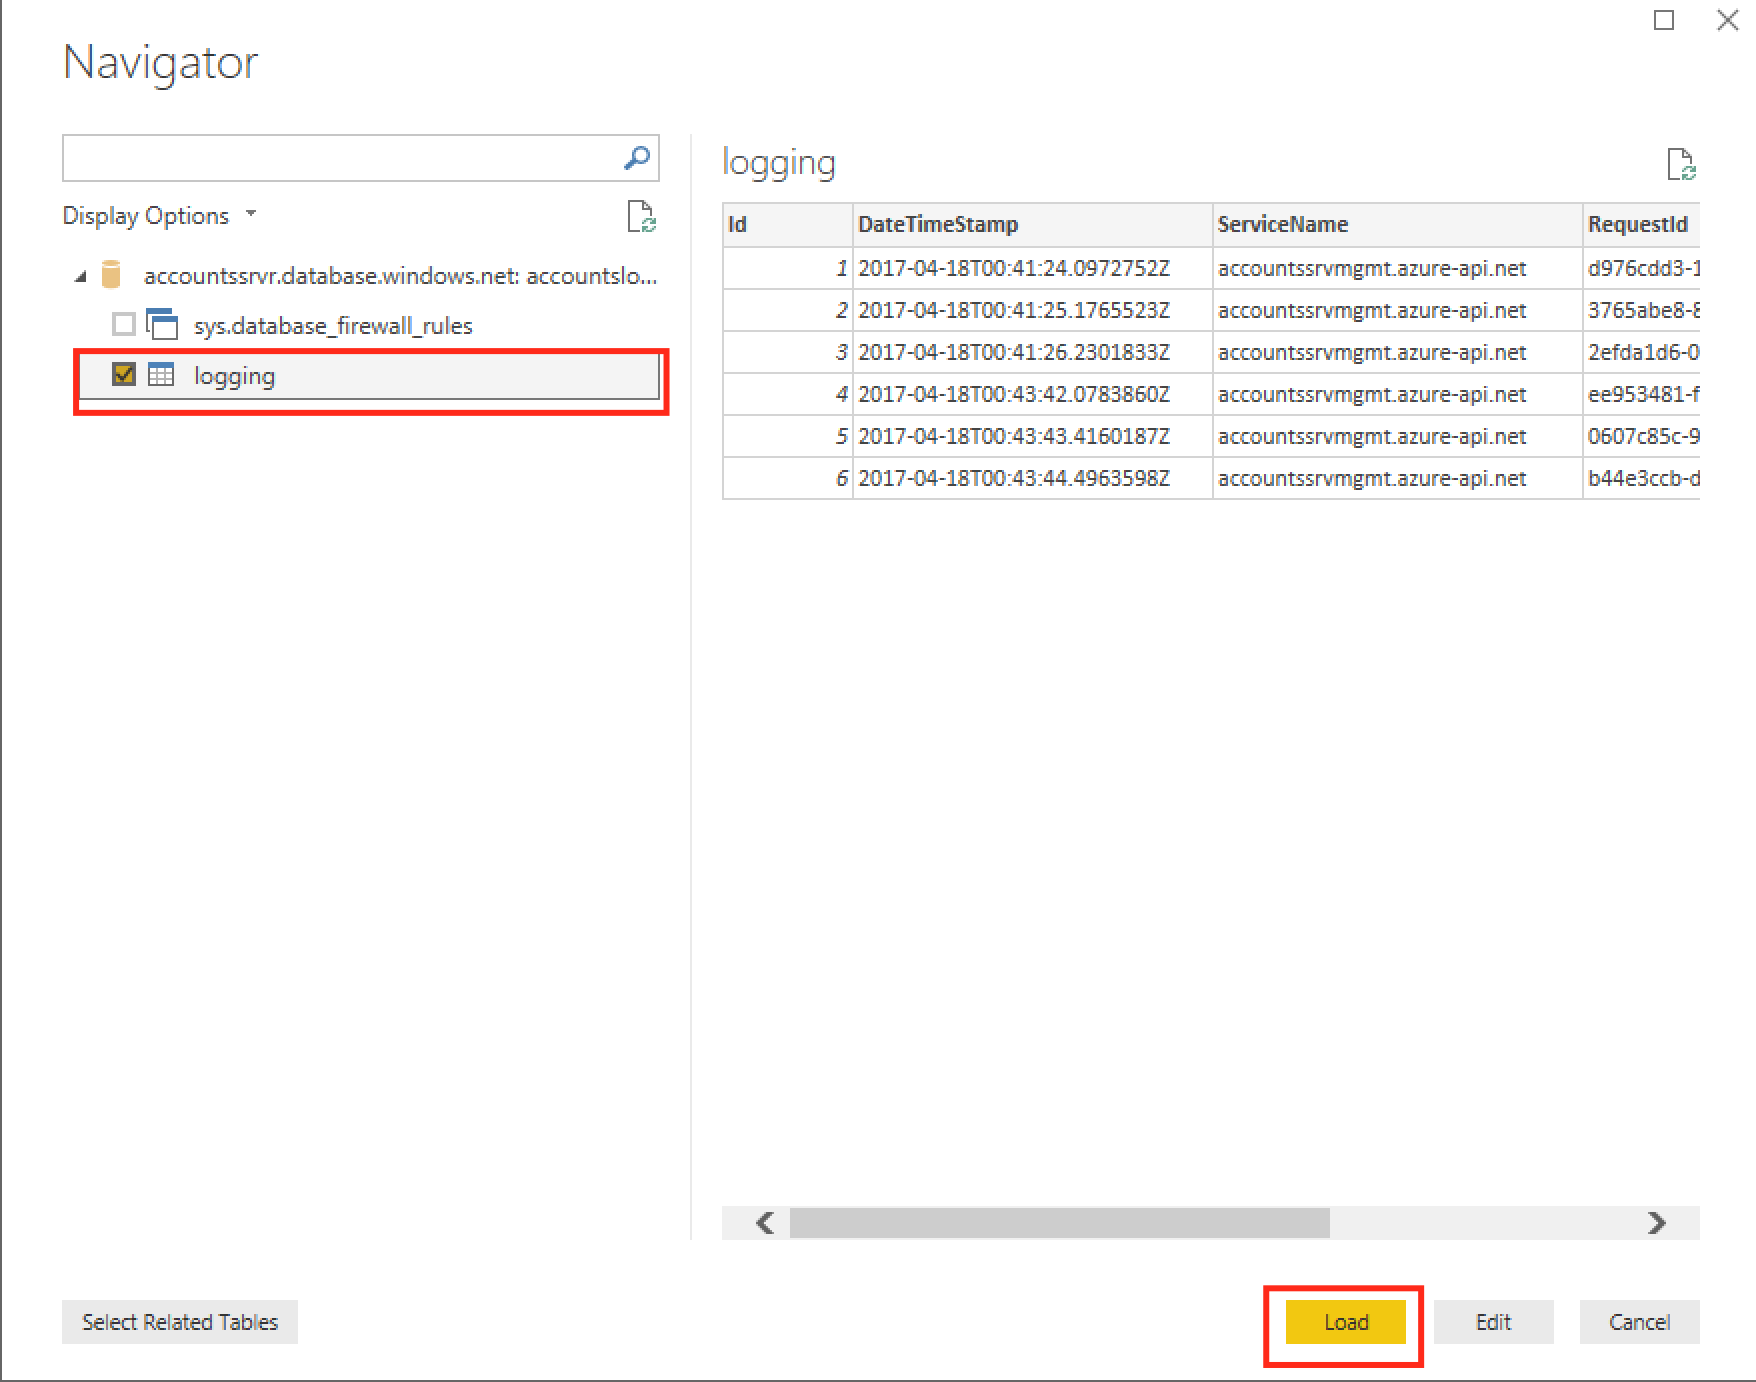
Figure 121-Select table to load the data
Once the data is loaded, you should see the table fields shown in the fields section
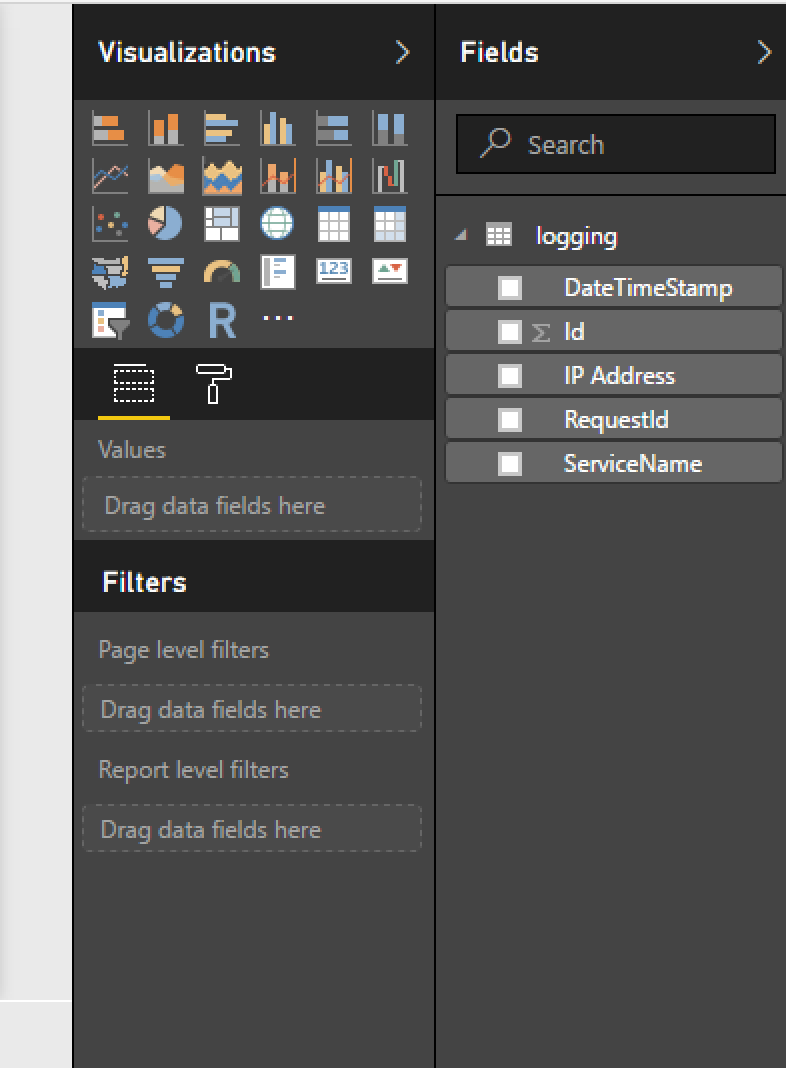
Figure 122 – Table fields displayed in the UI
Click the “Pie Chart” in the visualizations section and select the fields “IP Address” and “RequestId” and drag the field “IP Address” in the “Details” field and “RequestId” in the “Values” field.
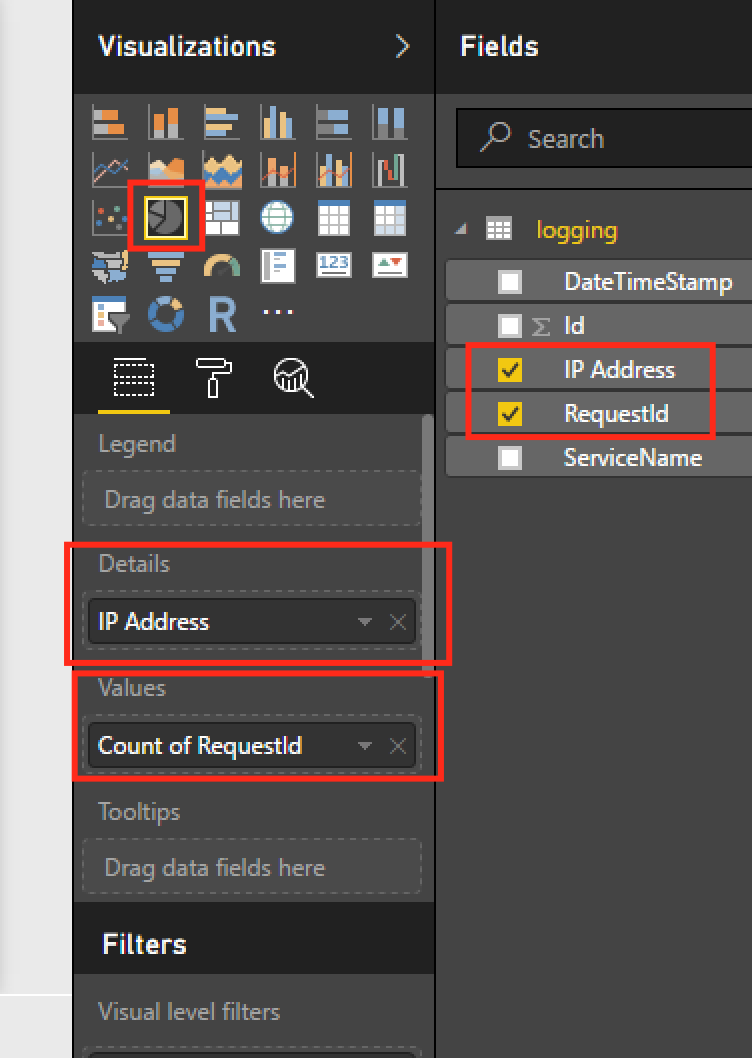
Figure 123 – Creating the Pie chart
Here we are trying to generate a pie chart that displays count of RequestId by IP Address.
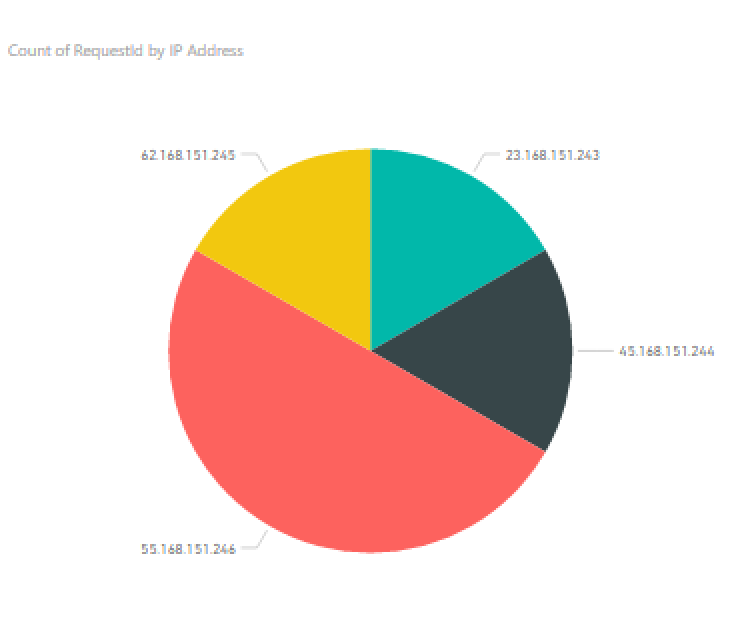
Figure 124 – Pie chart
If you place your cursor on each pie, you would see the IP Address and count of RequestIds in the tool tip. You can generate another chart by clicking the “Stacked Column Chart” by clicking the icon in the visualizations with the same fields selected.
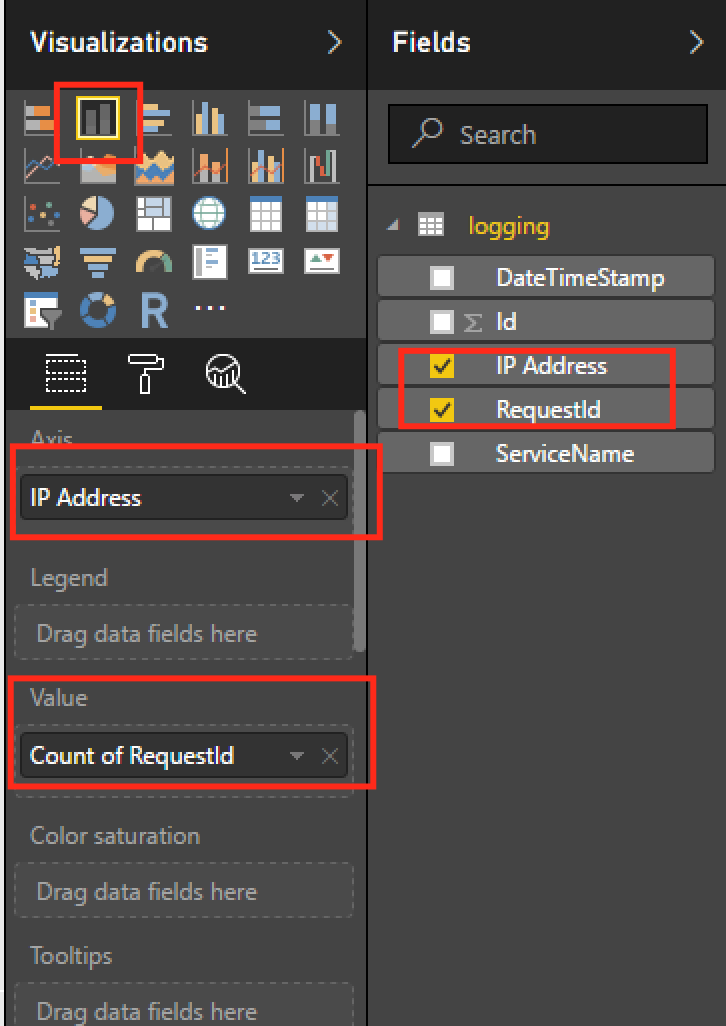
Figure 125 – Selecting the fields for Stacked Column chart
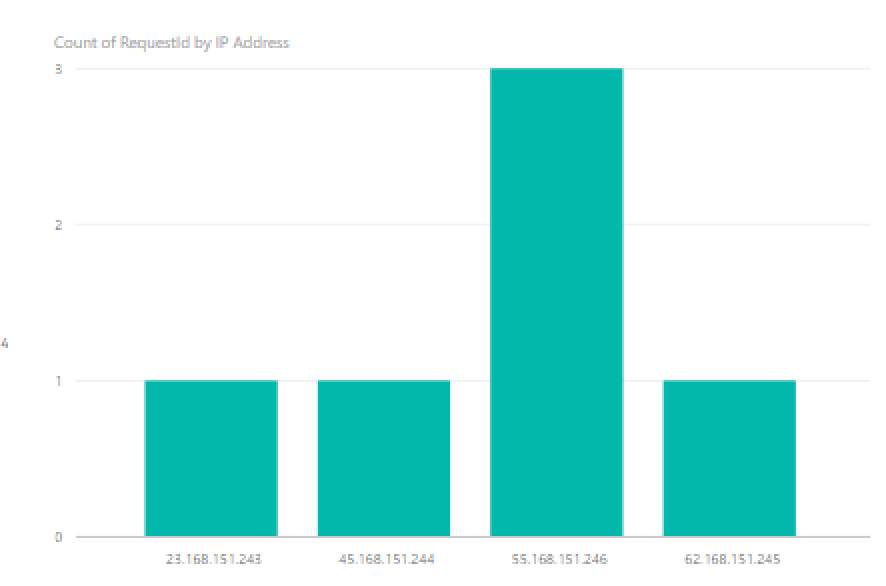
Figure 126 – Stacked Column chart (Count of RequestId by IP Address)
You can either save by clicking the “Save” on the top of the menu item or Publish your charts by clicking the “Publish” button in the top menu bar to share the charts with others. To publish to Power BI dashboard online, you need to provide the credentials to sign in.
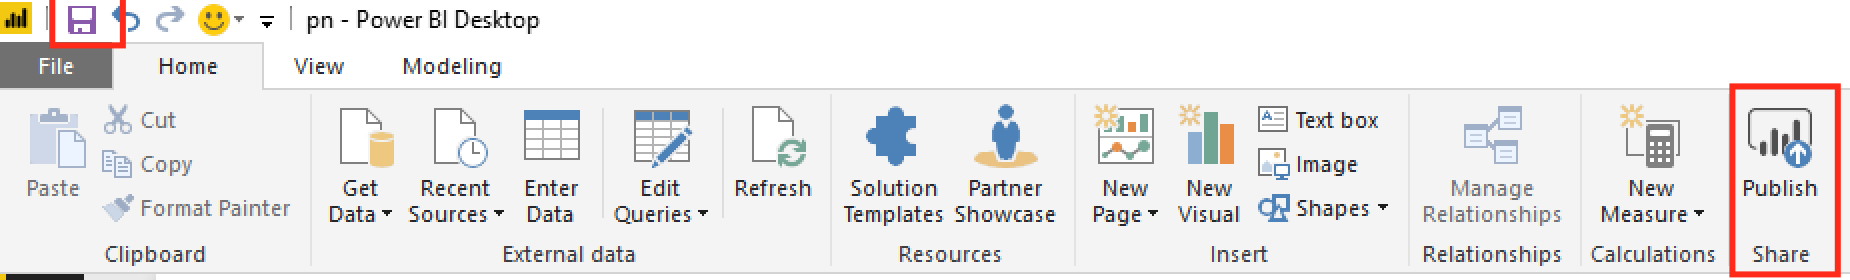
Figure 127 – Save/Share Option
This is a simple demo on using the Power BI as per the information we have collected. But in real projects we can generate charts that truly make sense.